The Email Health Dashboard gives you a clear, actionable overview of your email deliverability and sender reputation. It helps you spot problems early—before they impact inbox placement—and protect your sender reputation over time.
With high‑level KPIs, trend charts, and detailed tables, you can quickly identify where issues occur and drill down to the exact domains or accounts that need attention.
What you can do with the Email Health Dashboard
- Protect your sender reputation by monitoring bounces, complaints, and delivery rates
- Detect deliverability risks early by spotting negative trends before they turn into blocks or deferrals
- Understand performance over time, not just per sendout
- Drill down into details by receiving domain or sending account to find the root cause of issues
Date range
All data in the Email Health Dashboard is calculated based on the selected date range.
In the Date range selector, choose one of the following:
- Relative range – Select a predefined time period (for example, Last 7 days or Last 30 days)
- Custom range – Select a start and end date manually. To view a single day, select the same date as both start and end
The selected date range applies to: – Overview cards – Time series charts – Domain and Account tables
Overview cards
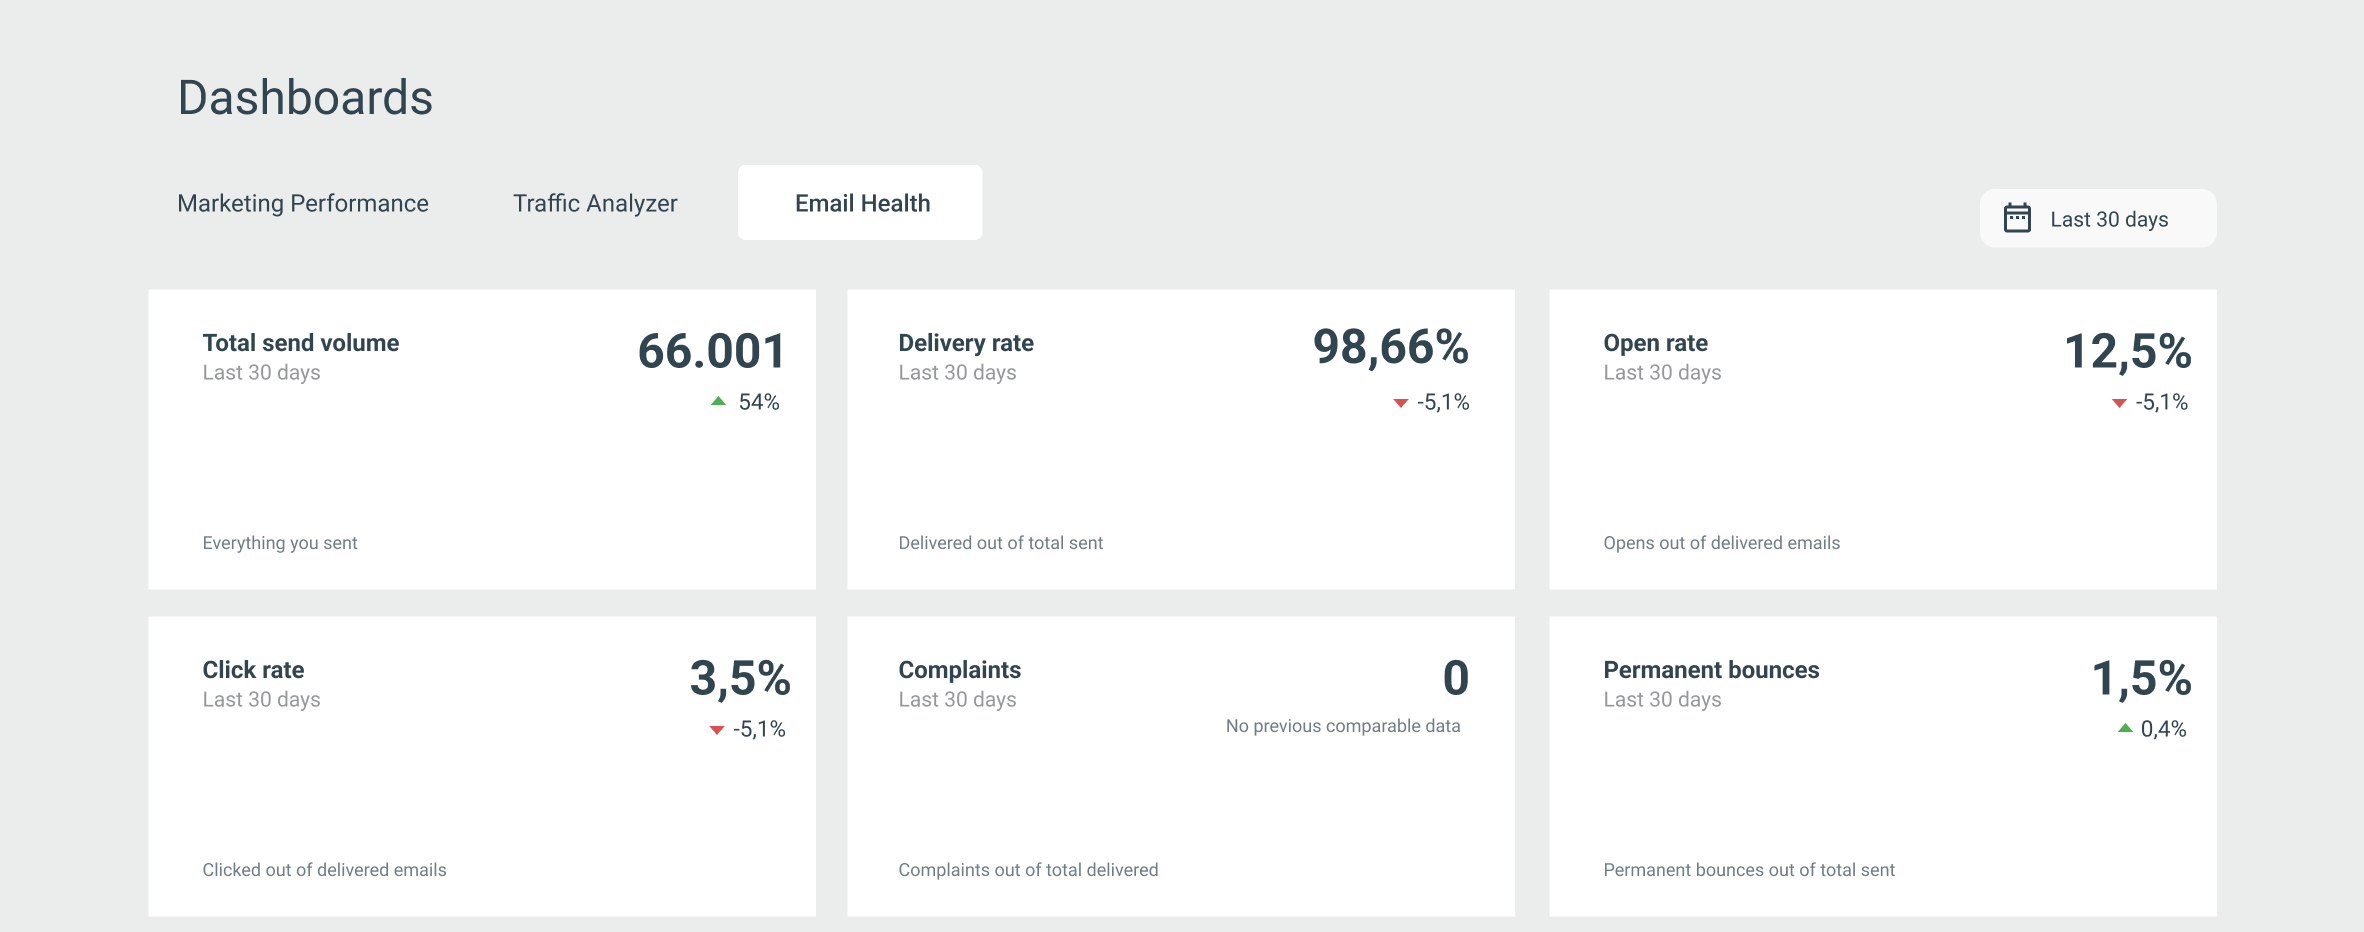
The overview cards give you a quick snapshot of your most important email health metrics:
- Total send volume – The total number of emails sent
- Delivery rate – Delivered emails as a percentage of total sent
- Open rate – Opens as a percentage of delivered emails
- Click rate – Clicks as a percentage of delivered emails
- Complaints – Spam complaints as a percentage of delivered emails
- Permanent bounces – Permanent bounces as a percentage of total sent
Each card also shows the change compared to the previous date range, helping you quickly identify improvements or negative trends.
Metrics charts
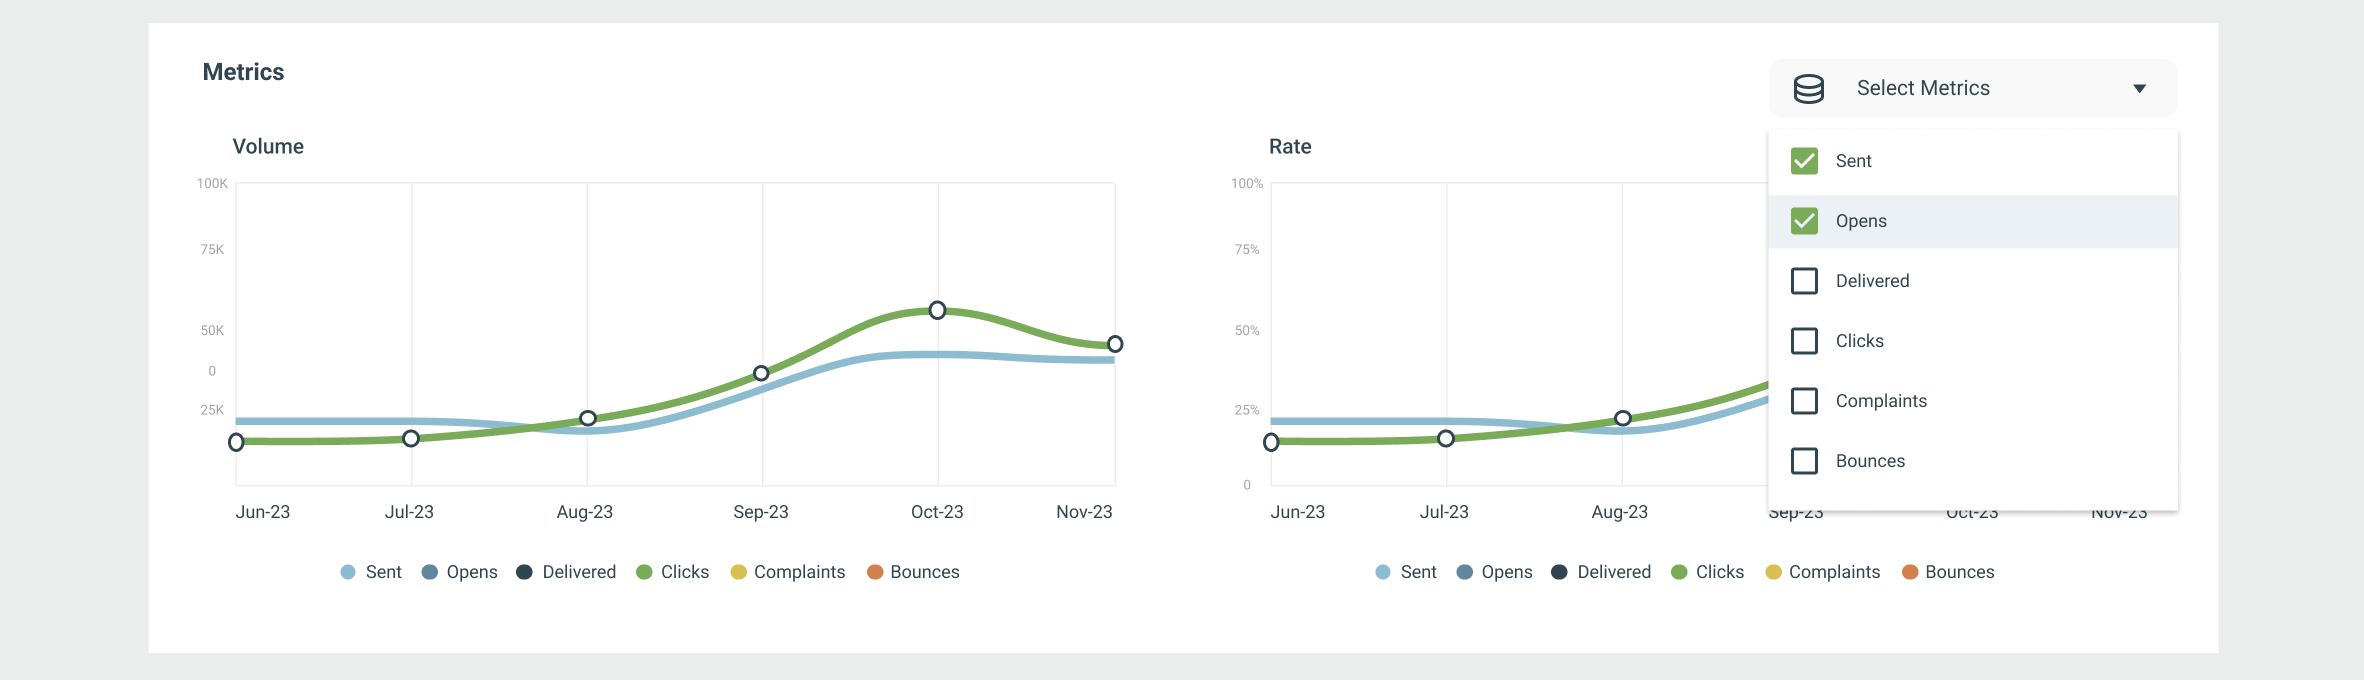
The Metrics section visualizes how your email health develops over time.
You will see two time series charts:
- Volume – Sent, delivered, opens, clicks, complaints, and bounces
- Rate – Percentage-based metrics such as delivery, open, click, bounce, and complaint rates
Interacting with the charts
- Hover over any date to see exact values for that day
- Use the Select metrics dropdown to choose which metrics to display
- Compare multiple metrics to identify correlations (for example, increased volume followed by higher bounce rates)
These charts are especially useful for spotting gradual changes that can signal future deliverability problems.
Domains table
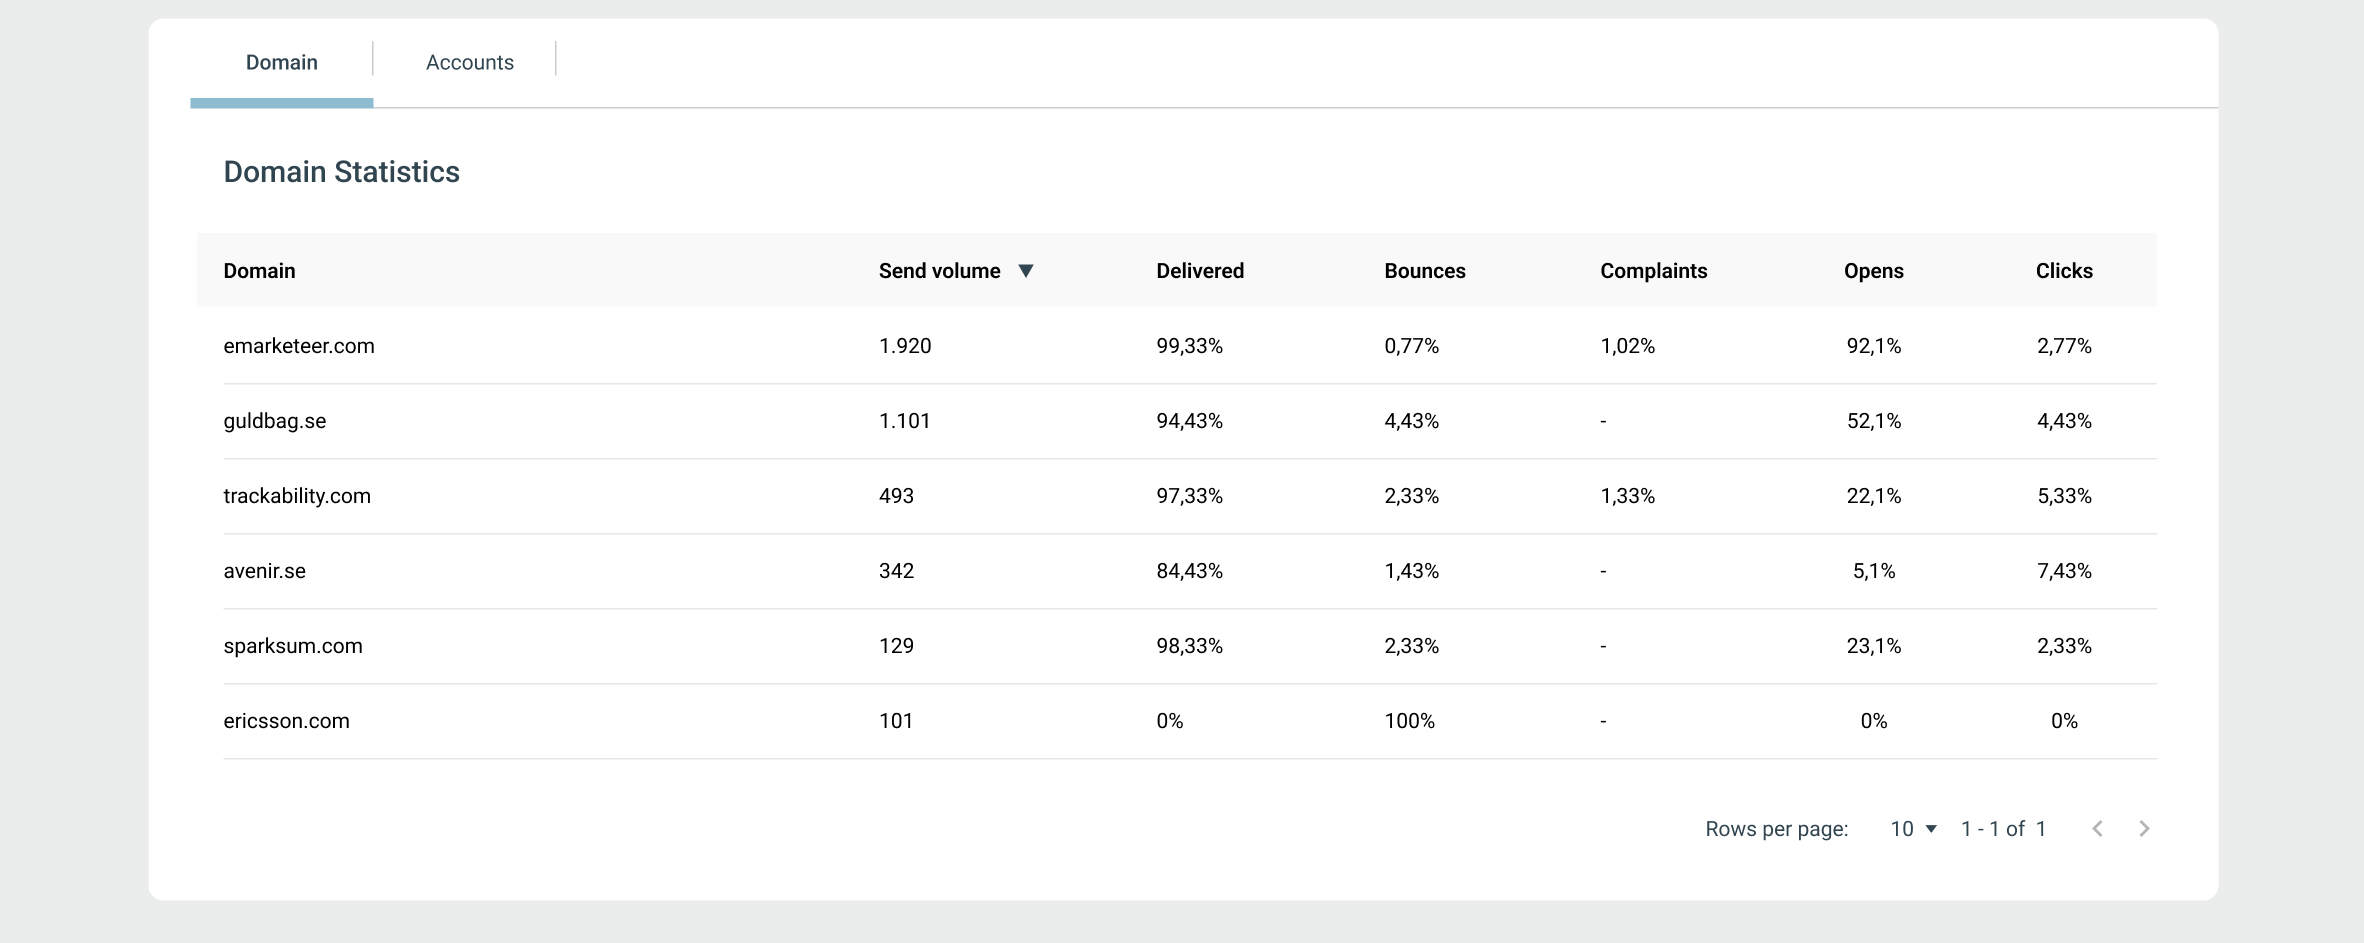
The Domains table shows how your emails perform for each receiving domain during the selected date range.
For each domain, you can see:
- Send volume
- Delivered (%)
- Bounces (%)
- Complaints (%)
- Opens (%)
- Clicks (%)
How to use the Domains table
- Sort columns to quickly identify domains with high bounce or complaint rates
- Compare engagement metrics across domains
- Identify specific receiving domains where reputation issues may be developing
Note: Only domains with at least 10 sent emails in the selected date range are included in the table.
Account table
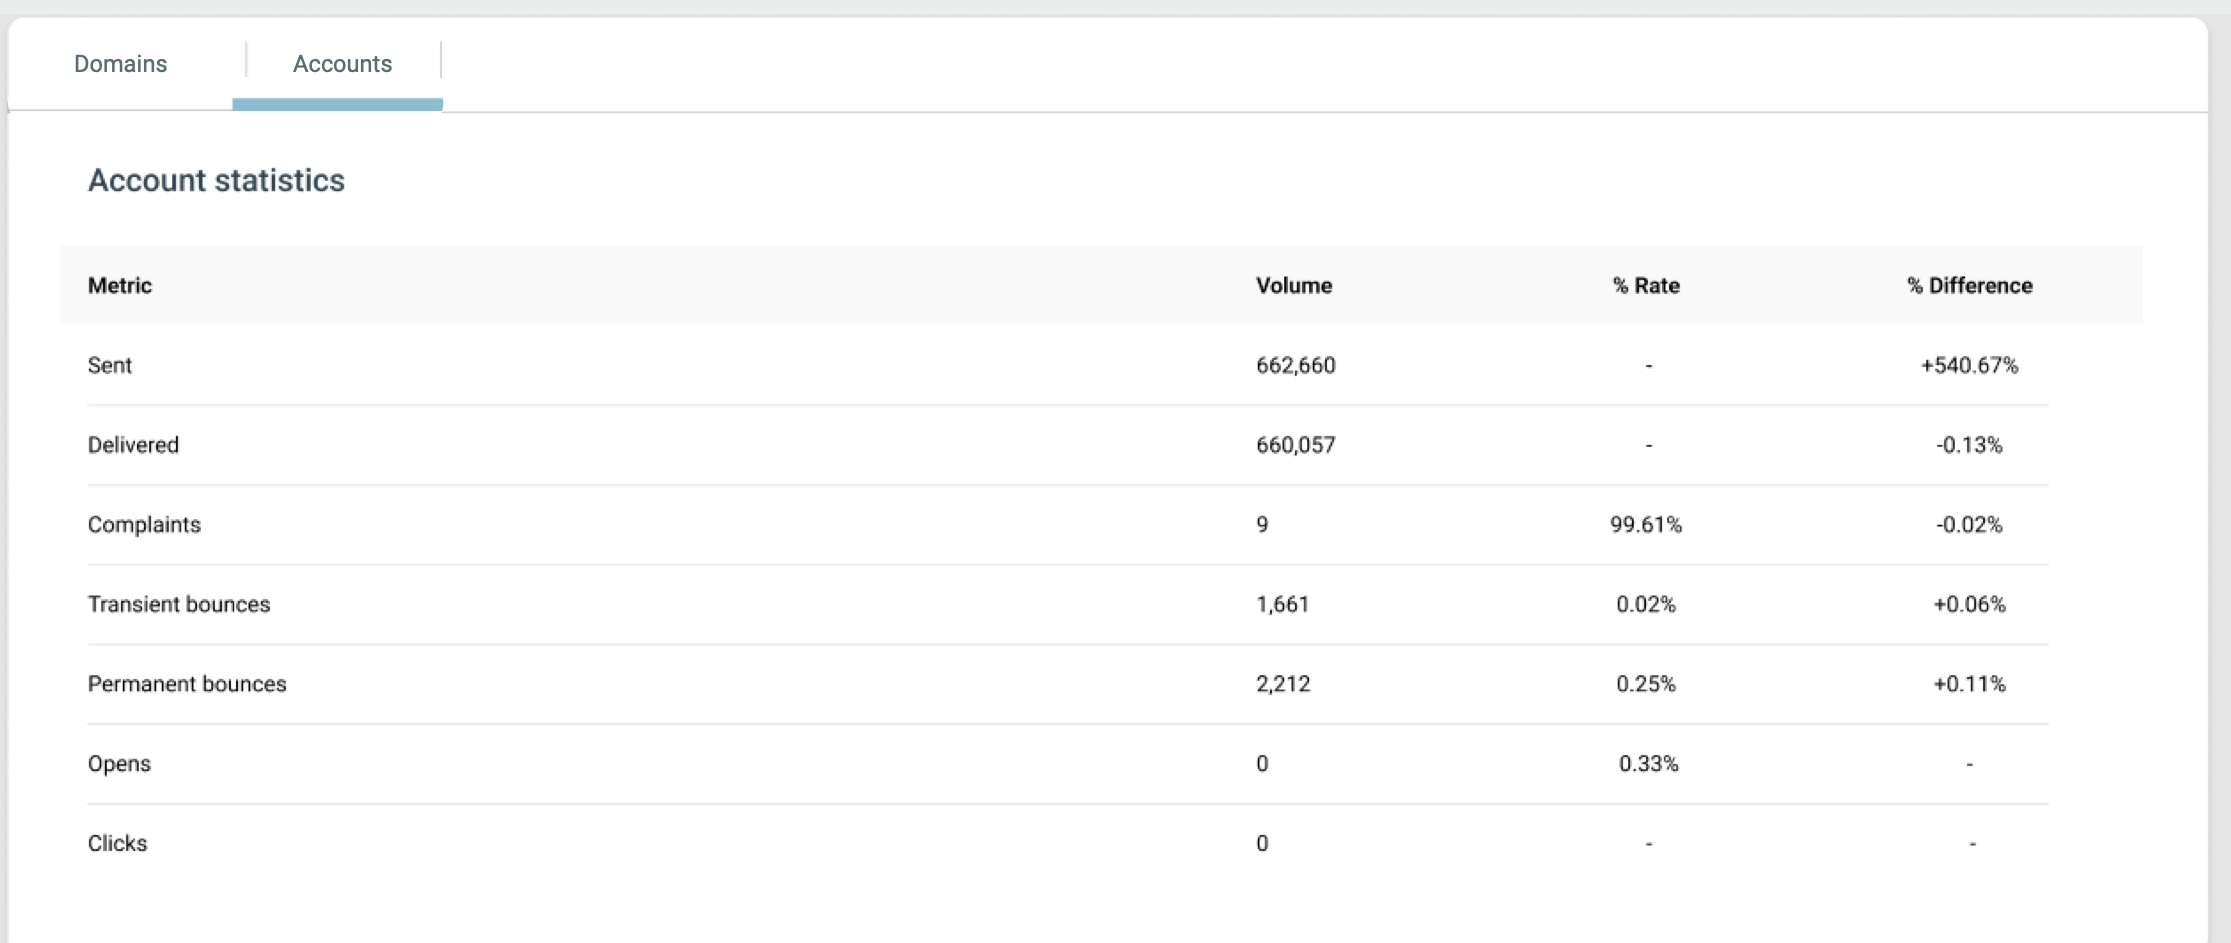
Switch to the Account tab to view email health statistics for the whole account.
This table shows:
- Volume and rate for:
- Sent
- Delivered
- Complaints
- Transient bounces
- Permanent bounces
- Opens
- Clicks
- Difference (%) compared to the previous date range
Understanding bounces and complaints
Bounces
A bounce occurs when an email cannot be delivered.
- Permanent bounces happen when there is a permanent issue, such as a non‑existent email address or a receiving server blocking your domain or IP
- Transient bounces occur due to temporary issues, such as a full inbox or a temporary server problem
High bounce rates signal poor list quality and can negatively impact your sender reputation.
Complaints
A complaint occurs when a recipient marks your email as spam using their email client.
Complaints are a strong negative signal to mailbox providers and can quickly damage your sender reputation if they increase.
Best practices
To maintain good email health:
- Regularly review bounce and complaint trends
- Remove inactive or invalid recipients from your lists
- Pay close attention to domains with declining delivery or engagement
- Act early when you see negative changes—small issues can quickly escalate
The Email Health Dashboard helps you take action before deliverability issues impact your results.